Introduction - Part I
Earlier this year, Reviewing Fairfield County Municipal Fiscal Indicators Since 2001 looked at data from 17 annual Connecticut Municipal Fiscal Indicators reports to better understand the current financial condition of all 169 towns. Those reports included only began including the net pension liability over the last three years and had no OPEB data. It turns out that the same disclosure by the Office of Policy Management includes separate tables for pension and other post employment benefits (OPEB). This post will be the first in a two-part series to explore the evolution of aggregated unfunded liabilities and financial vulnerability of Connecticut municipalities over time. Note that these liabilities are distinct from the State of Connecticut SERS and TRS pension funds which are even larger.
In the second post Replicating Yankee Institute Risk Score over 15 Years, we will take this and other municipal financial data, and replicate the analysis in Yankee Institute Warning Signs: Assessing Municipal Fiscal Health in Connecticut as closely as possible. In that report, intensive analysis was conducted using CAFR data to build a 2016 snapshot risk score for each town based on five factors combining financial statement and macroeconomic data to look at vulnerability to default. The risk score was based on research by Marc Joffe of the Reason Foundation studying attributes leading to municipal default experience during the Great Depression and subsequently which will be discussed in more detail in Part II. We will take the analysis a step further to calculate the evolution of municipal vulnerability for 115 towns since 2004.
Case Study: Bridgeport vs New Haven Pension Analysis
In Figure 1 below, we have aggregated every municipal pension fund by town from 2004 until 2017 (excluding 2011 which was not available in digital form). The table includes: actuarial-required and made contributions, gross pension liability, pension net assets, Assumed Rate of Return and net pension liabilities. It is possible to look for your town by typing the name in the Municipal search field c below to bring up the relevant data. It also can be sorted from largest unfunded or by towns making the smallest contributions relative to actuarial requirements.
For example, typing “Bridgeport” into the filter, it is possible to see that actual contributions were significantly lower than actuarial required contributions in every year, and reported pension net assets declined from $404 million in 2004 (14% underfunded) to just $169 million today (63% underfunded). It is also surprising how slowly Bridgeport’s liability has grown, but the number of covered employees has declined by over half during the period. With less than 1,000 retirees, it has about 1/3 as many covered employees than Stamford, which has a similar population. Unless pensioners in Bridgeport’s four pension funds are dying off at a astonishing rate, it looks like something else is going on here. The city did a pension bond transaction during 2016 which may partly explain the decline in covered participants, but the true liabilities are likely to be higher than reported in these numbers.
Figure 1: Pension Funding by Municipality since 2004
New Haven has a different, but possibly equally concerning problem. Plan participants have remained steady over the period, but there are about 20% more covered employees than comparably-sized Stamford. Unlike Bridgeport, New Haven has consistently met its actuarial required contributions over the period. Despite this, the reported liability has risen sharply, so the liability per plan participant has doubled to almost $320 thousand. Current net pension liability is close to $800 million, almost 4x the level 15 years ago. With an unrealistic assumed rate of return of 7.75%, the current net pension liability likely understates the true net pension liability (if anything).
Looking at Municipal Pension Liabilities in Aggregate
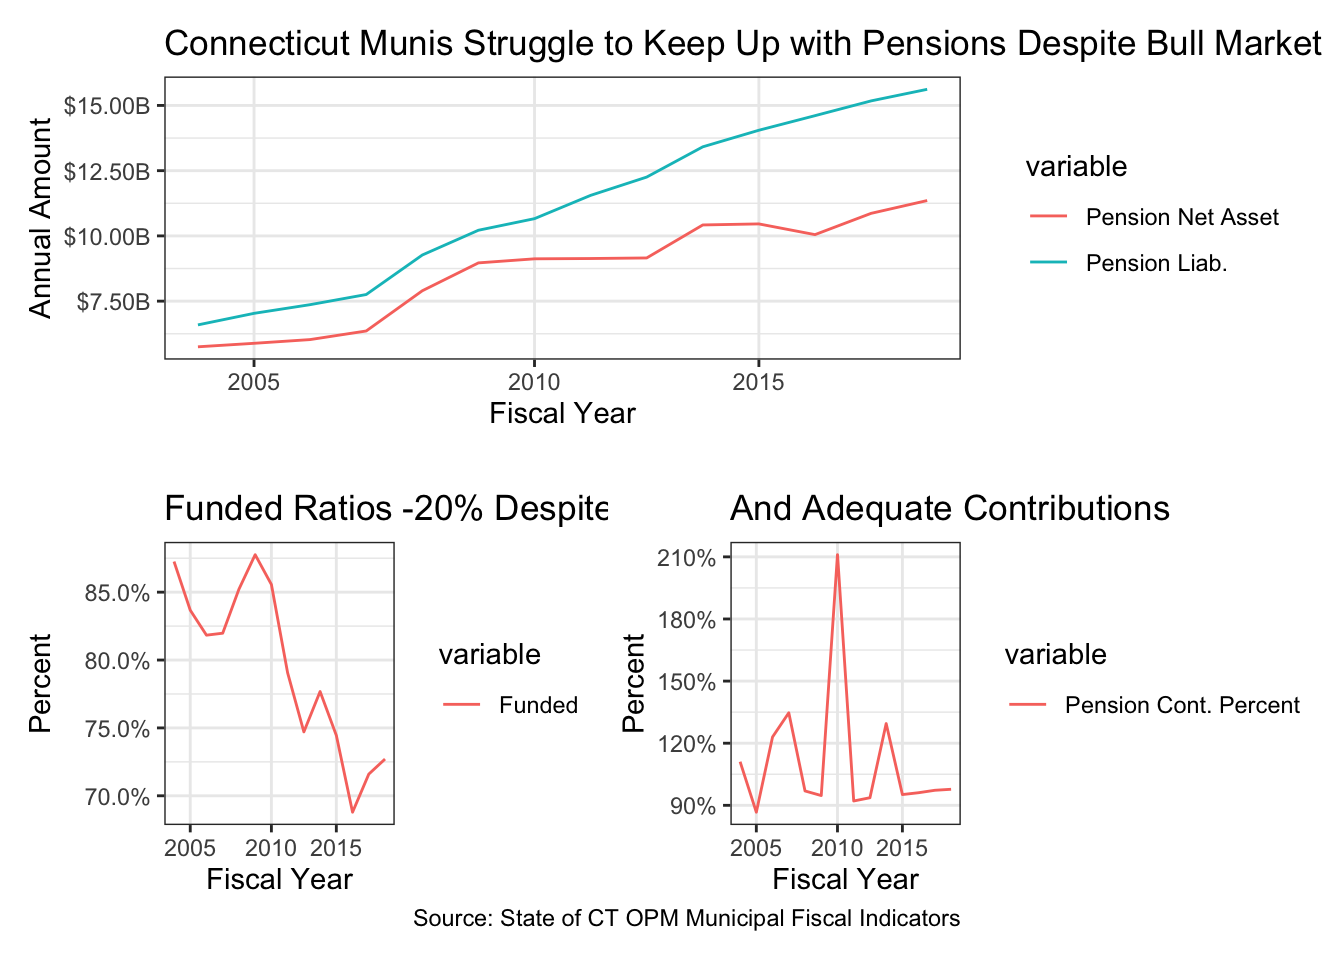
As shown in Figure 2 below adding all municipalities together, statewide pension assets tracked liabilities even through the great recession, but have fallen off sharply in the last few years. Bridgeport aside, municipalities in aggregate have come close to making actuarial-required contributions over the period, but the New Haven problem of liabilities outpacing income growth and pulling away from reserves to pay them. As a result, the aggregate municipal funding level has steadily fallen by almost 20% since 2009, despite the bull market in equities. This is especially worrying considering that the decline in funding has corresponded with one of the biggest bull markets in history.

Figure 2: Pension Liability and Funding Over Time
Gross OPEB Liabilities Funding Has Only Just Begun
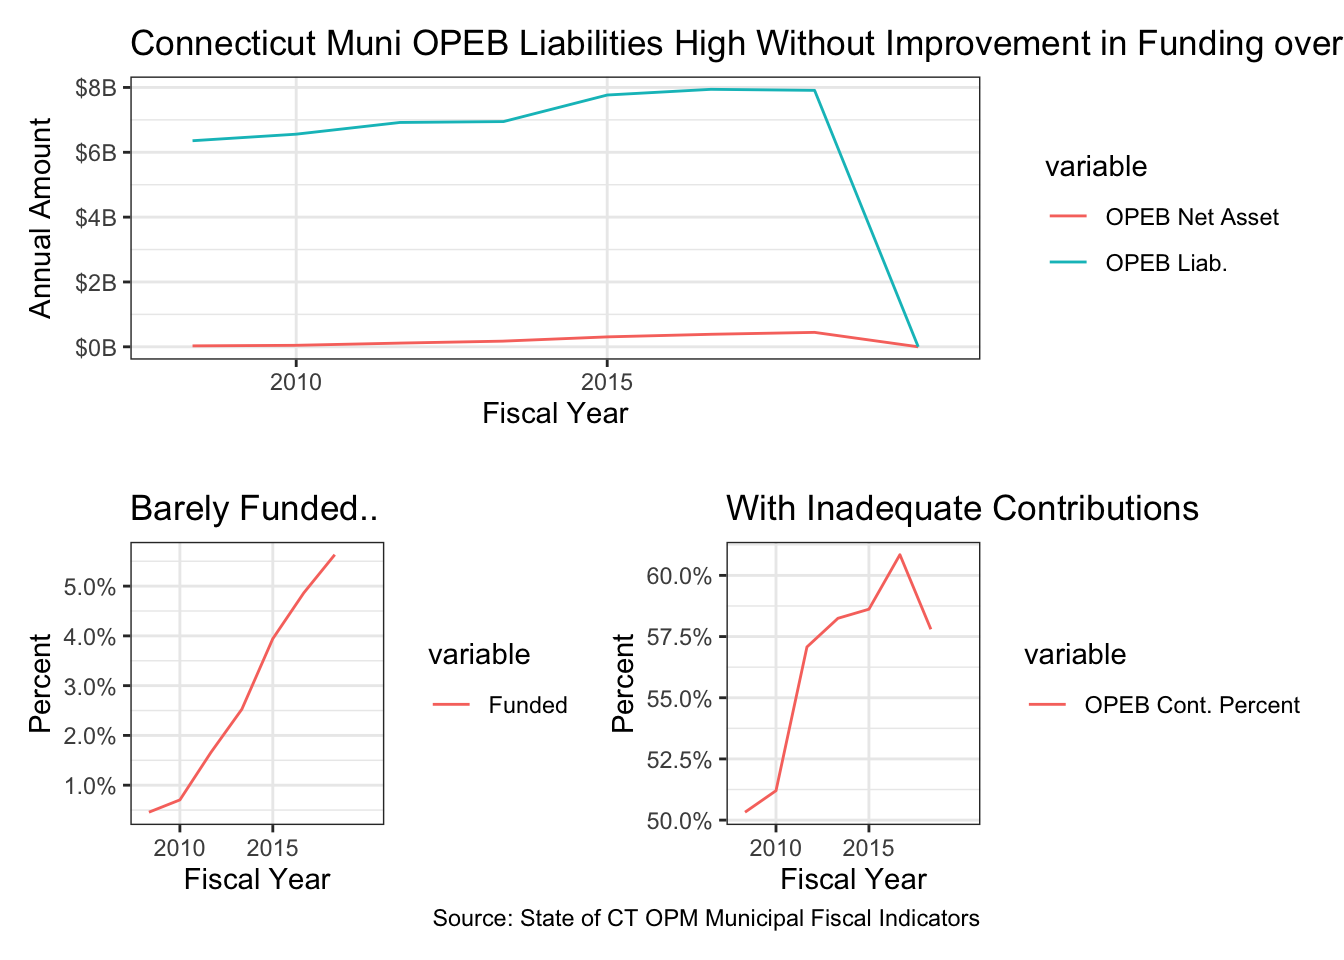
Data regarding OPEB liabilities as part of the digital MFI report are only available since 2009, but what available is concerning. We also only have complete data for about 115 of 169 towns, so 50-55 are missing from most years. Although missing towns are usually smaller, the reason for their exclusion is not known. The aggregate OPEB liability for known towns as of 2009 was already >$6B. Unfortunately, these municipalities have hardly begun the task of funding these commitments with annual funding at less than 60% of required. In addition, if the database is correct, no municipal employees have been asked to make any contribution to their retiree health benefits.
Returning to Bridgeport, there are close to 7,000 employees with OPEB coverage, making the <1,000 covered by pension benefits look all the more surprising. The town typically makes half of the required OPEB contribution, but if the disclosures are correct, has no assets in reserve to cover pertaining to post-retirement benefits. Because contributions are shown, there probably are some OPEB assets which have not making it to the report for the last nine years, in itself a concern. Knowing the rate of inflation of medical care over the last decade, the 2017 liability as shown is below that of 2009 is hard to believe given the rate of inflation for health care. New Haven and even more prudent towns in Fairfield County don’t look that different from Bridgeport in total OPEB liabilities. Based on this cursory study, it seems like some oversight is overdue for Bridgeport.
Figure 3: OPEB Funding by Municipality since 2009
Plot of Aggregated CT OPEB since 2009
The State of Connecticut is responsible for teacher pensions, but individual towns cover OPEB for town employees and teachers. For that reason, the 110k covered OPEB employees state-wide exceeds 72k covered by pension benefits. While the number of employees eligible for OPEB benefits has shown steady, growth in the liability has been much slower than pensions and looks surprisingly restrained in aggregate considering medical cost inflation. Employees have not yet been asked to contribute to these benefits, and assets currently set aside are way too small and have barely increased over the period. It seems clear that municipalities are not taking these obligations seriously.
Though the gross value of pension liabilities are double those of OPEB, the unfunded portion is similar. According to research by Marc Joffe, it may be easier for municipalities to avoid responsibility for OPEB commitments than for pensions, which over time have come to be perceived to rival bondholders in seniority. Either way, it seems unlikely that future taxpayers can afford to fully cover these liabilities, and cruel by leadership to not come clean as soon as possible to enable those employees to make plans for shortfalls.

Figure 4: OPEB Liabilities and Funding Over Time
Conclusion
Redwall Analytics had low expectations going into this analysis. It may be that the data as shown in the MFI disclosure is wrong, missing parts or otherwise inaccurate, but if prudent stewardship was expected by our leadership, it was not evident in these numbers. If any Connecticut-based company exhibited the kind of financial behavior shown by some of these disclosures, there would be public outcry and non-stop news coverage. Time will tell if the press has overlooked this out of ignorance of its significance because it pertains to complex financial matters or deliberately looked the other way, but the silence has been notable.